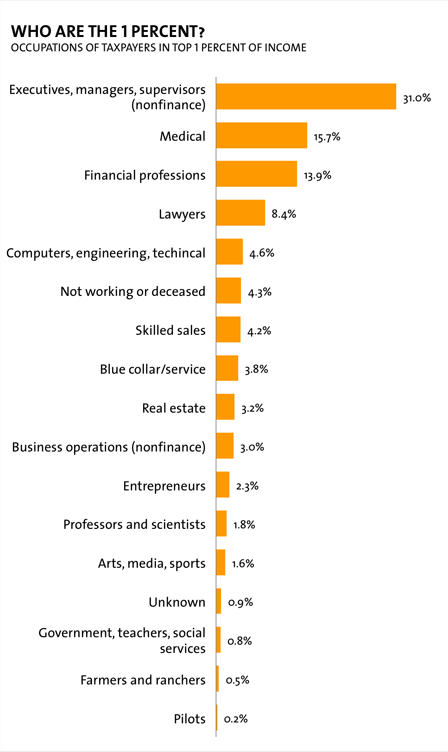
The Greed That Is BEYOND COMPREHENSION!
Here is some information that I have compiled for your understanding of a greed that is BEYOND COMPREHENSION! These people do not possess any HUMAN TRAITS at all. Regardless of what they call their SKIN COLOR, they have NO CONCERN for any people at all. They do not give a DAMN about your SKIN COLOR! If you think, because all of these rich and powerful men and women will call themselves "WHITE (98%)", that they care for those that call themselves "WHITE", that are of the economical distress that all the world is in.........You are a DAMN FOOL!
These are the "BASTARD SLIP"! HANOCH - ENOCH 10 And to
Gabriel, YHWH said, “Proceed against the bastards and the reprobates and
against the children of adultery; and destroy the children of adultery and expel
the children of the Watchers from among the people. And send them against one
another so that they may be destroyed in the fight, for length of days have they
not.”
Wisdom of Solomon 4:3 But the multiplying brood of the
wicked shall not thrive, nor take deep rooting from bastard slips, nor
lay any fast foundation.
These are "illegitimate children of wealth". They are the "mongrel children of alienate heathens from the LOVE of YHWH in YHWHSHUA! They DO NOT GIVE A DAMN ABOUT ANYONE! Their wealth has come by "GREED and the ROBBING" of the POOR! They have no heritage! YHWH and ONLY YHWH, will bring them down. Do not despair "Children of YisraYah".... YHWHSHUA is the ANSWER for all of our NEED!
DEBARIM - DEUTERONOMY 23:2 A bastard shall not enter into the congregation of YHWH; even to his tenth generation shall he not enter into the congregation of YHWH.
Look at the resolution of The Most High YHWH! These are HIS WORDS, concerning those that ROB the POOR of The earth. There nature and the reward of them.
KOHETET - ECCLESIASTES 5:13 There is a sore evil which I have seen under the sun, namely, riches {o'-sher' wealth, riches} kept for the owners thereof to their hurt.
Why do you think that the phrase "Filthy Rich" is used to describe this kind of wealth? Because they are "FILTHY". Filthy in the Hebrew expression in his description of these people is {aw-lakh'}, that implies "to be corrupt morally, tainted, figuratively and intransitive! These are WICKED PEOPLE!
This is a collage of articles and information that you will read. I tried to incorporate information from different resources in this piece. The different colors of ink is to let you know when I have includes other information sources. The base of the main article is in :BLACK INK" .
YHWH barak all YisraYah in YHWHSHUA!
Raah Dawid YisraYah
The article (s) begins here:
Many tout the U.S. as the Roman empire of the modern world. But as it turns out,
that comparison may not be all good.
Income inequality in America is at levels even higher than those in ancient Rome Over the last 30 years, wealth in the United States has been steadily concentrating in the upper economic echelons. Whereas the top 1 percent used to control a little over 30 percent of the wealth, they now control 40 percent. It’s a trend that was for decades brushed under the rug but is now on the tops of minds and at the tips of tongues.
Since too much inequality can foment revolt and instability, the CIA regularly updates statistics on income distribution for countries around the world, including the U.S. Between 1997 and 2007, inequality in the U.S. grew by almost 10 percent, making it more unequal than Russia, infamous for its powerful oligarchs. The U.S. is not faring well historically, either. Even the Roman Empire, a society built on conquest and slave labor, had a more equitable income distribution.
To determine the size of the Roman economy and the distribution of income, historians Walter Schiedel and Steven Friesen pored over papyri ledgers, previous scholarly estimates, imperial edicts, and Biblical passages. Their target was the state of the economy when the empire was at its population zenith, around 150 C.E. Schiedel and Friesen estimate that the top 1 percent of Roman society controlled 16 percent of the wealth, less than half of what America’s top 1 percent control.
To arrive at that number, they broke down Roman society into its established and implicit classes. Deriving income for the majority of plebeians required estimating the amount of wheat they might have consumed. From there, they could backtrack to daily wages based on wheat costs (most plebs did not have much, if any, discretionary income). Next they estimated the incomes of the “respectable” and “middling” sectors by multiplying the wages of the bottom class by a coefficient derived from a review of the literature. The few “respectable” and “middling” Romans enjoyed comfortable, but not lavish, lifestyles.
Above the plebs were perched the elite Roman orders. These well-defined classes played important roles in politics and commerce. The ruling patricians sat at the top, though their numbers were likely too few to consider. Below them were the senators. Their numbers are well known—there were 600 in 150 C.E.—but estimating their wealth was difficult. Like most politicians today, they were wealthy—to become a senator, a man had to be worth at least 1 million sesterces (a Roman coin, abbreviated HS). In reality, most possessed even greater fortunes. Schiedel and Friesen estimate the average senator was worth over HS5 million and drew annual incomes of more than HS300,000.
After the senators came the equestrians. Originally the Roman army’s cavalry, they evolved into a commercial class after senators were banned from business deals in 218 B.C. An equestrian’s holdings were worth on average about HS600,000, and he earned an average of HS40,000 per year. The Decurion's, or city councilmen, occupied the step below the equestrians. They earning about HS9,000 per year and held assets of around HS150,000. Other miscellaneous wealthy people drew incomes and held fortunes of about the same amount as the Decurion's.
In total, Schiedel and Friesen figure the elite orders and other wealthy made up about 1.5 percent of the 70 million inhabitants the empire claimed at its peak. Together, they controlled around 20 percent of the wealth.
These numbers paint a picture of two Rome's, one of respectable, if not fabulous, wealth and the other of meager wages, enough to survive day-to-day but not enough to prosper. The wealthy were also largely concentrated in the cities. It’s not unlike the U.S. today. Indeed, based on a widely used measure of income inequality, the Gini coefficient, imperial Rome was slightly more equal than the U.S.
The CIA, World Bank, and other institutions track the Gini coefficients of modern nations. It’s a unitless number, which can make it somewhat tricky to understand. I find visualizing it helps. Take a look at the following graph.
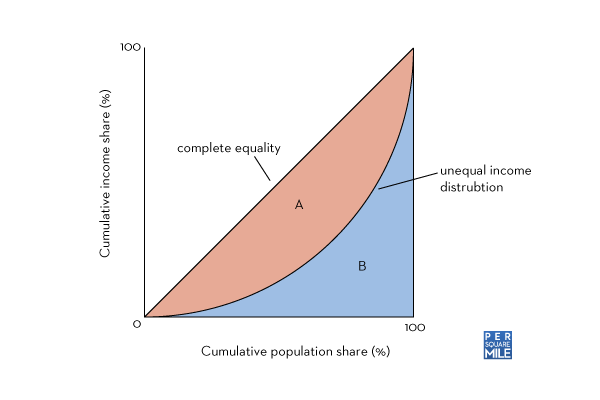
To calculate the Gini coefficient, you divide the orange area (A) by the sum of the orange and blue areas (A + B). The more unequal the income distribution, the larger the orange area. The Gini coefficient scales from 0 to 1, where 0 means each portion of the population gathers an equal amount of income and 1 means a single person collects everything. Schiedel and Friesen calculated a Gini coefficient of 0.42–0.44 for Rome. By comparison, the Gini coefficient in the U.S. in 2007 was 0.45.
Schiedel and Friesen aren’t passing judgment on the ancient Romans, nor are they on modern day Americans. Theirs is an academic study, one used to further scholarship on one of the great ancient civilizations. But buried at the end, they make a point that’s difficult to parse, yet provocative. They point out that the majority of extant Roman ruins resulted from the economic activities of the top 10 percent. “Yet the disproportionate visibility of this ‘fortunate decile’ must not let us forget the vast but—to us—inconspicuous majority that failed even to begin to share in the moderate amount of economic growth associated with large-scale formation in the ancient Mediterranean and its hinterlands.”
In other words, what we see as the glory of Rome is really just the rubble of the rich, built on the backs of poor farmers and laborers, traces of whom have all but vanished. It’s as though Rome’s 99 percent never existed. Which makes me wonder, what will future civilizations think of us?
Scheidel, W., & Friesen, S. (2010). The Size of the Economy and the Distribution of Income in the Roman Empire Journal of Roman Studies, 99 DOI:10.3815/007543509789745223
According to a recent study from two historians, Walter Schiedel and Steven Friesen, cited by Per Square Mile. After analyzing papyri ledgers, biblical passages and other previous scholarly estimates, the researchers found that the top one percent of earners in Ancient Rome controlled 16 percent of the society's wealth. By comparison, the top one percent of American earners control 40 percent of the country's wealth: Americans have been watching protests against oppressive regimes that concentrate massive wealth in the hands of an elite few. Yet in our own democracy, 1 percent of the people take nearly a quarter of the nation’s income—an inequality even the wealthy will come to regret.
It’s no use pretending that what has obviously happened has not in fact happened. The upper 1 percent of Americans are now taking in nearly a quarter of the nation’s income every year. In terms of wealth rather than income, the top 1 percent control 40 percent. Their lot in life has improved considerably. Twenty-five years ago, the corresponding figures were 12 percent and 33 percent. One response might be to celebrate the ingenuity and drive that brought good fortune to these people, and to contend that a rising tide lifts all boats. That response would be misguided. While the top 1 percent have seen their incomes rise 18 percent over the past decade, those in the middle have actually seen their incomes fall. For men with only high-school degrees, the decline has been precipitous—12 percent in the last quarter-century alone. All the growth in recent decades—and more—has gone to those at the top. In terms of income equality, America lags behind any country in the old, ossified Europe that President George W. Bush used to deride. Among our closest counterparts are Russia with its oligarchs and Iran. While many of the old centers of inequality in Latin America, such as Brazil, have been striving in recent years, rather successfully, to improve the plight of the poor and reduce gaps in income, America has allowed inequality to grow.
Economists long ago tried to justify the vast inequalities that seemed so troubling in the mid-19th century—inequalities that are but a pale shadow of what we are seeing in America today. The justification they came up with was called “marginal-productivity theory.” In a nutshell, this theory associated higher incomes with higher productivity and a greater contribution to society. It is a theory that has always been cherished by the rich. Evidence for its validity, however, remains thin. The corporate executives who helped bring on the recession of the past three years—whose contribution to our society, and to their own companies, has been massively negative—went on to receive large bonuses. In some cases, companies were so embarrassed about calling such rewards “performance bonuses” that they felt compelled to change the name to “retention bonuses” (even if the only thing being retained was bad performance). Those who have contributed great positive innovations to our society, from the pioneers of genetic understanding to the pioneers of the Information Age, have received a pittance compared with those responsible for the financial innovations that brought our global economy to the brink of ruin.
Some people look at income inequality and shrug their shoulders. So what if this person gains and that person loses? What matters, they argue, is not how the pie is divided but the size of the pie. That argument is fundamentally wrong. An economy in which most citizens are doing worse year after year—an economy like America’s—is not likely to do well over the long haul. There are several reasons for this.
First, growing inequality is the flip side of something else: shrinking opportunity. Whenever we diminish equality of opportunity, it means that we are not using some of our most valuable assets—our people—in the most productive way possible. Second, many of the distortions that lead to inequality—such as those associated with monopoly power and preferential tax treatment for special interests—undermine the efficiency of the economy. This new inequality goes on to create new distortions, undermining efficiency even further. To give just one example, far too many of our most talented young people, seeing the astronomical rewards, have gone into finance rather than into fields that would lead to a more productive and healthy economy.
Third, and perhaps most important, a modern economy requires “collective action”—it needs government to invest in infrastructure, education, and technology. The United States and the world have benefited greatly from government-sponsored research that led to the Internet, to advances in public health, and so on. But America has long suffered from an under-investment in infrastructure (look at the condition of our highways and bridges, our railroads and airports), in basic research, and in education at all levels. Further cutbacks in these areas lie ahead.
None of this should come as a surprise—it is simply what happens when a society’s wealth distribution becomes lopsided. The more divided a society becomes in terms of wealth, the more reluctant the wealthy become to spend money on common needs. The rich don’t need to rely on government for parks or education or medical care or personal security—they can buy all these things for themselves. In the process, they become more distant from ordinary people, losing whatever empathy they may once have had. They also worry about strong government—one that could use its powers to adjust the balance, take some of their wealth, and invest it for the common good. The top 1 percent may complain about the kind of government we have in America, but in truth they like it just fine: too gridlocked to re-distribute, too divided to do anything but lower taxes.
Economists are not sure how to fully explain the growing inequality in America. The ordinary dynamics of supply and demand have certainly played a role: laborsaving technologies have reduced the demand for many “good” middle-class, blue-collar jobs. Globalization has created a worldwide marketplace, pitting expensive unskilled workers in America against cheap unskilled workers overseas. Social changes have also played a role—for instance, the decline of unions, which once represented a third of American workers and now represent about 12 percent.
But one big part of the reason we have so much inequality is that the top 1 percent want it that way. The most obvious example involves tax policy. Lowering tax rates on capital gains, which is how the rich receive a large portion of their income, has given the wealthiest Americans close to a free ride. Monopolies and near monopolies have always been a source of economic power—from John D. Rockefeller at the beginning of the last century to Bill Gates at the end. Lax enforcement of anti-trust laws, especially during Republican administrations, has been a godsend to the top 1 percent. Much of today’s inequality is due to manipulation of the financial system, enabled by changes in the rules that have been bought and paid for by the financial industry itself—one of its best investments ever. The government lent money to financial institutions at close to 0 percent interest and provided generous bailouts on favorable terms when all else failed. Regulators turned a blind eye to a lack of transparency and to conflicts of interest.
When you look at the sheer volume of wealth controlled by the top 1 percent in this country, it’s tempting to see our growing inequality as a quintessentially American achievement—we started way behind the pack, but now we’re doing inequality on a world-class level. And it looks as if we’ll be building on this achievement for years to come, because what made it possible is self-reinforcing. Wealth begets power, which begets more wealth. During the savings-and-loan scandal of the 1980s—a scandal whose dimensions, by today’s standards, seem almost quaint—the banker Charles Keating was asked by a congressional committee whether the $1.5 million he had spread among a few key elected officials could actually buy influence. “I certainly hope so,” he replied. The Supreme Court, in its recent Citizens United case, has enshrined the right of corporations to buy government, by removing limitations on campaign spending. The personal and the political are today in perfect alignment. Virtually all U.S. senators, and most of the representatives in the House, are members of the top 1 percent when they arrive, are kept in office by money from the top 1 percent, and know that if they serve the top 1 percent well they will be rewarded by the top 1 percent when they leave office. By and large, the key executive-branch policymakers on trade and economic policy also come from the top 1 percent. When pharmaceutical companies receive a trillion-dollar gift—through legislation prohibiting the government, the largest buyer of drugs, from bargaining over price—it should not come as cause for wonder. It should not make jaws drop that a tax bill cannot emerge from Congress unless big tax cuts are put in place for the wealthy. Given the power of the top 1 percent, this is the way you would expect the system to work.
America’s inequality distorts our society in every conceivable way. There is, for one thing, a well-documented lifestyle effect—people outside the top 1 percent increasingly live beyond their means. Trickle-down economics may be a chimera, but trickle-down behaviorism is very real. Inequality massively distorts our foreign policy. The top 1 percent rarely serve in the military—the reality is that the “all-volunteer” army does not pay enough to attract their sons and daughters, and patriotism goes only so far. Plus, the wealthiest class feels no pinch from higher taxes when the nation goes to war: borrowed money will pay for all that. Foreign policy, by definition, is about the balancing of national interests and national resources. With the top 1 percent in charge, and paying no price, the notion of balance and restraint goes out the window. There is no limit to the adventures we can undertake; corporations and contractors stand only to gain. The rules of economic globalization are likewise designed to benefit the rich: they encourage competition among countries for business, which drives down taxes on corporations, weakens health and environmental protections, and undermines what used to be viewed as the “core” labor rights, which include the right to collective bargaining. Imagine what the world might look like if the rules were designed instead to encourage competition among countries for workers. Governments would compete in providing economic security, low taxes on ordinary wage earners, good education, and a clean environment—things workers care about. But the top 1 percent don’t need to care.
According to Vanity Fair. (h/t Think Progress) The 99 Percent Movement effectively changed the American political debate from debt and deficits to income inequality, highlighting the fact that income inequality has increased so much in the U.S. that it is now more unequal than countries like Ivory Coast and Pakistan. While those numbers are startling, a study from two historians suggests that American wealth inequality may actually be worse than it was in Ancient Rome — a society built on slave labor, a defined class structure, and centuries of warfare and conquest.
In the United States, the top 1 percent controls roughly 40 percent of the nation’s wealth. According to the study, which examined Roman ledgers, previous estimates, imperial edicts, and Biblical passages, Rome’s top 1 percent controlled less than half that at the height of its economic power, as Tim De Chant notes at Per Square Mile:
Their target was the state of the economy when the empire was at its population zenith, around 150 C.E. Schiedel and Friesen estimate that the top 1 percent of Roman society controlled 16 percent of the wealth, less than half of what America’s top 1 percent control.
Of course, the millions of Romans at the bottom of the empire’s class structure — the conquered and enslaved, the poorest Romans, and the women who had little civic or economic empowerment — would probably disagree with the study’s conclusion. Still, it serves as yet another highlight of how large the income gap in the United States has become over the last three decades.
The findings add to the growing chorus of studies and criticisms indicating that the wealth gap is hitting truly remarkable levels. The top one percent saw their incomes rise by 275 percent , America's 99 percent are not just imagining it. The gap between the incomes of the rich and poor in this new Gilded Age is strikingly broad and deep, according to an October report from Congress' data crunchers.
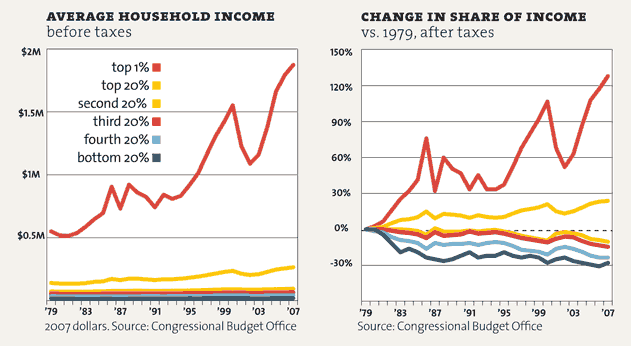
The study by the Congressional Budget Office, released this week, found that income has become dramatically concentrated, shifting heavily toward the top earners between 1979 and 2007.
And although incomes at all levels have risen some, they've skyrocketed for the very wealthiest of earners.
At the other end of the scale, Americans in the bottom fifth of earners saw their incomes increase by less than 20 percent across the nearly three decades. Incomes for those in the middle 60 percent climbed by less than 40 percent over the same span.
Things start to look especially good for the top fifth of earners, who saw their cash flow jump by 65 percent.
But it's among the top 1 percent where the growth was breathtaking. That contingent saw their incomes spike by 275 percent.
"It is really stunning the degree to which rewards have been concentrated at the top," said Josh Bivens, an economist at the left-leaning Economic Policy Institute. "We have now returned to Gilded Age levels of inequality."
The CBO report revealed some other stark facts. While incomes did rise up and down the ladder, the explosive growth for the top 1 percent so vastly outweighed the expansion further down that the top 1 percent's share of the nation's total income more than doubled to just over 20 percent.
The hoarding at the top was so great that even after accounting for taxes, the "income received by the 20 percent of the population with the highest income exceeded the aftertax income of the remaining 80 percent," the CBO found.
between 1979 and 2007, according to the Congressional Budget Office, while the bottom fifth of earners only saw their incomes grow by 20 percent during that same period.
In addition, the total net worth of the bottom 60 percent of Americans is less than that of the Forbes 400 richest Americans , Listening to Republicans on the campaign trail or the House floor, one might think the quickest way to eliminate the deficit is to make Americans who earn the least pay more in taxes. "Part of the problem is today only 53 percent pay any federal income tax at all; 47 percent pay nothing,” Rep. Michele Bachmann (R-Minn.) told a crowd in South Carolina, repeating a conservative meme. "We need to broaden the base so that everybody pays something, even if it’s a dollar."
Beyond Bachmann, the idea has been spread by Republicans from Texas Gov. Rick Perry, Florida Sen. Marco Rubio and former Utah Gov. Jon Huntsman to members of the House and Senate leadership. It was brought up again in Wednesday's GOP presidential debate by other candidates.
"Daily Show" host Jon Stewart recently zinged the GOP for its relentless focus on the poor, noting that even if the government took absolutely everything the bottom 50 percent owned, it would still raise only about $700 billion (never mind the starvation that would result).
Perhaps even more shocking, the six heirs to the retail giant WalMart had the same net worth in 2007 as the bottom 30 percent of Americans
The Occupy Wall Street movement has brought increased focus on the disparity between the top one percent of earners and everyone else in the United States. But one American family paints a particularly stark picture of the country's wealth gap.
The six children of Walmart's founders, Sam and James
"Bud" Walton, had the same net worth in 2007 as the entire bottom 30 percent of
American earners,
according to an analysis from Sylvia Allegretto (Much of the current
political and popular discourse has focused on inequalities that exist in the
U.S. In particular the Occupy movement has brought the huge disparities in
wealth to the forefront. There are a few questions floating around about wealth.
First, how skewed is the distribution? Second, it is true that the rich have
gotten much richer over time? —a statement I often heard my Grandma make.
Upon closer inspection, the Forbes list reveals that six Waltons—all children
(one daughter-in-law) of Sam or James “Bud” Walton the founders of Wal-Mart—were
on the list. The combined worth of the Walton six was $69.7 billion in
2007—which equated to the total wealth of the entire bottom thirty percent! BTW
the new 2011 Forbes 400 has the inherited worth of these six Waltons at $93
billion. The 2010 SCF data that is slated for release spring of 2012 will almost
certainly show a further widening of the wealth gap given that corporate
profits, stocks and CEO pay have all recovered while housing values & equity
(the lion’s share of wealth for average American’s), wages and family incomes
have yet to turn around.
These revelations renewed my interest in the inheritance and estate tax debates.
Also, didn’t I just read somewhere that
Wal-Mart is substantially rolling back health care coverage for part-time
workers and significantly raising premiums for many full-time staff?
We’ve got to get serious about reversing the long term trend of the ever
increasing concentration of income and wealth into the hands of a few at the
expense of the many. At stake is nothing less than our economy and our
democracy.)
Well, there is a plethora of statistics (e.g. here,
here, &
var _paq = _paq || [];
_paq.push(["setDocumentTitle", document.domain + "/" + document.title]);
_paq.push(["setDomains", ["*.yahwehsword.org","*.yahwehsword.com"]]);
_paq.push(["trackPageView"]);
_paq.push(["enableLinkTracking"]);
(function() {
var u=(("https:" == document.location.protocol) ? "https" : "http") + "://www.yahwehsword.org/panalytics/";
_paq.push(["setTrackerUrl", u+"piwik.php"]);
_paq.push(["setSiteId", "1"]);
var d=document, g=d.createElement("script"), s=d.getElementsByTagName("script")[0]; g.type="text/javascript";
g.defer=true; g.async=true; g.src=u+"piwik.js"; s.parentNode.insertBefore(g,s);
})();
http://www.motherjones.com/politics/2011/02/income-inequality-in-america-chart-graph">here)
out there but here are two. The share of wealth held by the top fifth is about
87.2 percent while the bottom four-fifths share the remaining 12.8 percent of
wealth—so the Occupiers are correct in their assessment. And, the riches of
those in the top 1 percent are about 225 times greater than that held by the
typical family—it was 125 times in 1962—so, Grandma was correct too.
But, let’s look a bit further. The triennial Survey of Consumer Finances (SCF) is one of the best sources for data on wealth in the U.S. And, of course the Forbes 400 estimates the worth of the wealthiest amongst us—all 400 wouldn’t be captured in the SCF. If we look at both the SCF and the Forbes 400 we can glean some interesting insights.
In 2007 (the most recent SCF) the cumulative wealth of the Forbes 400 was $1.54 trillion or roughly the same amount of wealth held by the entire bottom fifty percent of American families. This is a stunning statistic to be sure.
The six children of Walmart's founders, Sam and James "Bud" Walton, had the same net worth in 2007 as the entire bottom 30 percent of American earners, a labor economist at University of California-Berkeley's Center on Wage and Employment Dynamics.
Though the 2007 figure is striking, the gap between the Walmart heirs and the rest of the country may get even bigger -- the Walton's combined fortune has grown by more than $20 billion, according to data compiled from the Forbes 400 this year. (
Allegretto compared the Waltons' net worth in 2007, according to Forbes magazine, to the Federal Reserve's 2007 Survey of Consumer Finances.
The difference between the wealth of the Walmart heirs and the rest of the country epitomizes a much larger American story. The top one percent of American earners saw their incomes grow 275 percent between 1979 and 2007, according to the Congressional Budget Office, while the bottom one-fifth experienced only 20 percent income growth during the same period.
Looking at it another way: The var _paq = _paq || []; _paq.push(["setDocumentTitle", document.domain + "/" + document.title]); _paq.push(["setDomains", ["*.yahwehsword.org","*.yahwehsword.com"]]); _paq.push(["trackPageView"]); _paq.push(["enableLinkTracking"]); (function() { var u=(("https:" == document.location.protocol) ? "https" : "http") + "://www.yahwehsword.org/panalytics/"; _paq.push(["setTrackerUrl", u+"piwik.php"]); _paq.push(["setSiteId", "1"]); var d=document, g=d.createElement("script"), s=d.getElementsByTagName("script")[0]; g.type="text/javascript"; g.defer=true; g.async=true; g.src=u+"piwik.js"; s.parentNode.insertBefore(g,s); })(); http://www.motherjones.com/politics/2011/02/income-inequality-in-america-chart-graph"> top 10 percent of U.S. earners control two-thirds of the country's wealth and the richest 400 Americans control as much wealth as the bottom 50 percent of Americans. The difference is so stark that the public opinion has turned against it: nearly three-quarters of respondents to a poll put out by The Hill said they think income inequality is a problem.
But the rise in income inequality isn't limited to
America. In 17 out of 22 countries the Organization for Economic Cooperation and
Development tracks, the
wealth gap has grown more pronounced since 1985 (Scales continue to tip in
the rich's favor the world around.
Income inequality -- the gap between a society's richest members and its poorest
-- is rising not only in the United States but in most of the world's major
economies, according to a new report from the Organization for Economic
Cooperation and Development.
Since 1985, income inequality has grown more pronounced in 17 of the 22
countries for which the OECD has long-term data, including Mexico, Italy, Japan,
Australia, Canada and the United Kingdom.
The OECD's report suggests an explanation for why the Occupy Wall Street
movement has grown from a single protest site in New York's Zuccotti Park to a
global phenomenon with hundreds of chapters in dozens of countries. Among other
things, protesters in the Occupy movement say they oppose the concentration of
wealth in the hands of fewer and fewer people.
In the United States, the incomes of the very highest earners have
grown by leaps and bounds over the last quarter century, while
remaining more or less flat for the vast majority of the population.
Comparable growth in the wealth gap has taken place in Germany, Finland, Israel,
Sweden, Luxembourg and New Zealand, according to the OECD. Only five countries
-- Greece, Turkey, France, Belgium and Hungary -- saw their levels of income
inequality decline or remain constant.
Income inequality has been linked to a
number of troubling economic trends, and some analysts believe the wealth
gap is contributing to the slow rate of recovery for the global economy.
Earlier this year, a study in the newsletter of the International Monetary Fund
suggested that a country is more likely to enjoy a sustained period of growth if
it has a relatively equitable distribution of income -- meaning that for the
wealthy, high-inequality nations named in the OECD report, bouncing back from
the worldwide recession may be taking longer than it needs to.
Income inequality has also been cited as a catalyzing factor for a number of
protest movements around the globe, including the riots in England this
summer and the Arab Spring uprisings in the Middle East on which the Occupy
Wall Street movement has been patterned.
An OECD press release notes that income inequality, besides affecting the
wealthy member-nations of the organization, is also a major concern in many
of the developing countries outside of it. The correlation between a
nation's wealth gap and its poverty and social and political instability was
suggested earlier this year, when The Atlantic published a world map color-coded
by inequality. China, Brazil, Rwanda, Uganda, Cote d'Ivoire and Serbia all
had high levels of income inequality -- as did the United States.
In addition, the world's millionaires control nearly 40 percent of global wealth, according to a Credit Suisse report cited by the Wall Street Journal.
And the phenomenon isn't just limited to the U.S. -- income inequality is on the rise in most of the world's major economies, according to the Organisation of Economic Development and Cooperation.
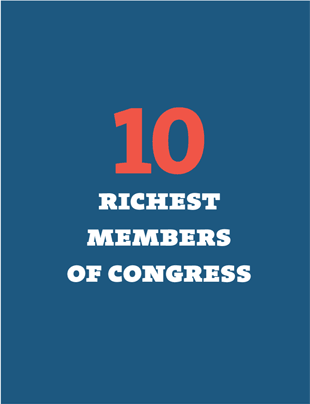
Ten Richest Members of Congress
|
|
|
|---|---|
| Rep. Darrell Issa (R-Calif.) | $451.1 million |
| Rep. Jane Harman (D-Calif.) | $435.4 million |
| Rep. Vern Buchanan (R-Fla.) | $366.2 million |
| Sen. John Kerry (D-Mass.) | $294.9 million |
| Rep. Jared Polis (D-Colo.) | $285.1 million |
| Sen. Mark Warner (D-Va.) | $283.1 million |
| Sen. Herb Kohl (D-Wisc.) | $231.2 million |
| Rep. Michael McCaul (R-Texas) | $201.5 million |
| Sen. Jay Rockefeller (D-W.Va.) | $136.2 million |
| Sen. Dianne Feinstein (D-Calif.) | $108.1 million |
|
|
|
See more charts like these? See our charts on the var _paq = _paq || []; _paq.push(["setDocumentTitle", document.domain + "/" + document.title]); _paq.push(["setDomains", ["*.yahwehsword.org","*.yahwehsword.com"]]); _paq.push(["trackPageView"]); _paq.push(["enableLinkTracking"]); (function() { var u=(("https:" == document.location.protocol) ? "https" : "http") + "://www.yahwehsword.org/panalytics/"; _paq.push(["setTrackerUrl", u+"piwik.php"]); _paq.push(["setSiteId", "1"]); var d=document, g=d.createElement("script"), s=d.getElementsByTagName("script")[0]; g.type="text/javascript"; g.defer=true; g.async=true; g.src=u+"piwik.js"; s.parentNode.insertBefore(g,s); })(); http://www.motherjones.com/politics/2011/06/speedup-americans-working-harder-charts">secrets of the jobless recovery, the var _paq = _paq || []; _paq.push(["setDocumentTitle", document.domain + "/" + document.title]); _paq.push(["setDomains", ["*.yahwehsword.org","*.yahwehsword.com"]]); _paq.push(["trackPageView"]); _paq.push(["enableLinkTracking"]); (function() { var u=(("https:" == document.location.protocol) ? "https" : "http") + "://www.yahwehsword.org/panalytics/"; _paq.push(["setTrackerUrl", u+"piwik.php"]); _paq.push(["setSiteId", "1"]); var d=document, g=d.createElement("script"), s=d.getElementsByTagName("script")[0]; g.type="text/javascript"; g.defer=true; g.async=true; g.src=u+"piwik.js"; s.parentNode.insertBefore(g,s); })(); http://www.motherjones.com/mojo/2011/10/one-percent-income-inequality-OWS"> richest 1 percent of Americans, and how the var _paq = _paq || []; _paq.push(["setDocumentTitle", document.domain + "/" + document.title]); _paq.push(["setDomains", ["*.yahwehsword.org","*.yahwehsword.com"]]); _paq.push(["trackPageView"]); _paq.push(["enableLinkTracking"]); (function() { var u=(("https:" == document.location.protocol) ? "https" : "http") + "://www.yahwehsword.org/panalytics/"; _paq.push(["setTrackerUrl", u+"piwik.php"]); _paq.push(["setSiteId", "1"]); var d=document, g=d.createElement("script"), s=d.getElementsByTagName("script")[0]; g.type="text/javascript"; g.defer=true; g.async=true; g.src=u+"piwik.js"; s.parentNode.insertBefore(g,s); })(); http://www.motherjones.com/politics/2011/04/taxes-richest-americans-charts-graph">super wealthy beat the IRS.
A huge share of the nation's economic growth over the past 30 years has gone to the top one-hundredth of one percent, who now make an average of $27 million per household. The average income for the bottom 90 percent of us? $31,244.
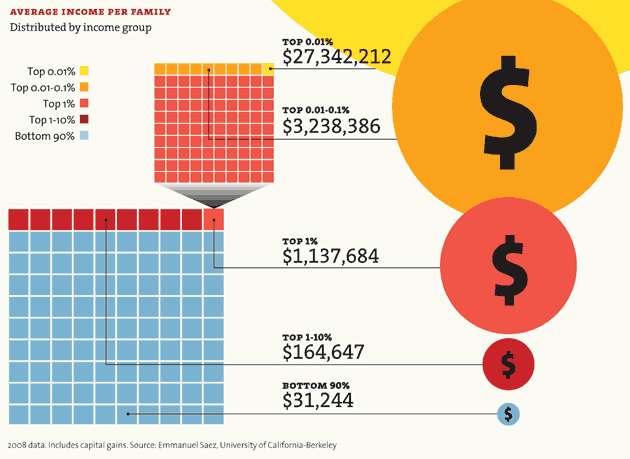
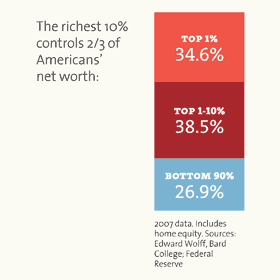
Note: The 2007 data (the most current) doesn't reflect the impact of the housing market crash. In 2007, the bottom 60% of Americans had 65% of their net worth tied up in their homes. The top 1%, in contrast, had just 10%. The housing crisis has no doubt further swelled the share of total net worth held by the superrich.
The superrich have grabbed the bulk of the past three decades' gains.
Download: PDF chart 1 (large) PDF chart 2 (large) | JPG chart 1 (smaller) JPG chart 2 (smaller)
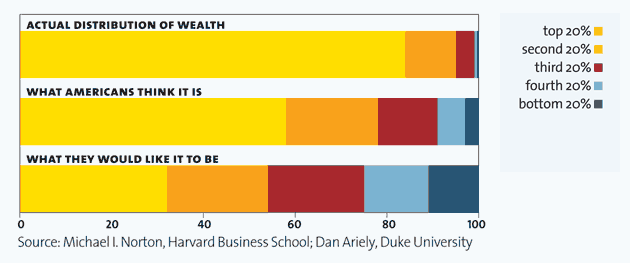
A Harvard business prof and a behavioral economist recently asked more than 5,000 Americans how they thought wealth is distributed in the United States. Most thought that it’s more balanced than it actually is. Asked to choose their ideal distribution of wealth, 92% picked one that was even more equitable.
Download: var _paq = _paq || []; _paq.push(["setDocumentTitle", document.domain + "/" + document.title]); _paq.push(["setDomains", ["*.yahwehsword.org","*.yahwehsword.com"]]); _paq.push(["trackPageView"]); _paq.push(["enableLinkTracking"]); (function() { var u=(("https:" == document.location.protocol) ? "https" : "http") + "://www.yahwehsword.org/panalytics/"; _paq.push(["setTrackerUrl", u+"piwik.php"]); _paq.push(["setSiteId", "1"]); var d=document, g=d.createElement("script"), s=d.getElementsByTagName("script")[0]; g.type="text/javascript"; g.defer=true; g.async=true; g.src=u+"piwik.js"; s.parentNode.insertBefore(g,s); })(); http://www.motherjones.com/files/outofbalance.pdf">PDF (large) | var _paq = _paq || []; _paq.push(["setDocumentTitle", document.domain + "/" + document.title]); _paq.push(["setDomains", ["*.yahwehsword.org","*.yahwehsword.com"]]); _paq.push(["trackPageView"]); _paq.push(["enableLinkTracking"]); (function() { var u=(("https:" == document.location.protocol) ? "https" : "http") + "://www.yahwehsword.org/panalytics/"; _paq.push(["setTrackerUrl", u+"piwik.php"]); _paq.push(["setSiteId", "1"]); var d=document, g=d.createElement("script"), s=d.getElementsByTagName("script")[0]; g.type="text/javascript"; g.defer=true; g.async=true; g.src=u+"piwik.js"; s.parentNode.insertBefore(g,s); })(); http://www.motherjones.com/files/averagehouseholdincome.jpg">JPG (smaller)
Why Washington is closer to Wall Street than Main Street.

|
|
|
|---|---|
| Rep. Darrell Issa (R-Calif.) | $451.1 million |
| Rep. Jane Harman (D-Calif.) | $435.4 million |
| Rep. Vern Buchanan (R-Fla.) | $366.2 million |
| Sen. John Kerry (D-Mass.) | $294.9 million |
| Rep. Jared Polis (D-Colo.) | $285.1 million |
| Sen. Mark Warner (D-Va.) | $283.1 million |
| Sen. Herb Kohl (D-Wisc.) | $231.2 million |
| Rep. Michael McCaul (R-Texas) | $201.5 million |
| Sen. Jay Rockefeller (D-W.Va.) | $136.2 million |
| Sen. Dianne Feinstein (D-Calif.) | $108.1 million |
|
|
|

Congressional data from 2009. Family net worth data from 2007. Sources: Center for Responsive Politics; US Census; Edward Wolff, Bard College.
Download: var _paq = _paq || []; _paq.push(["setDocumentTitle", document.domain + "/" + document.title]); _paq.push(["setDomains", ["*.yahwehsword.org","*.yahwehsword.com"]]); _paq.push(["trackPageView"]); _paq.push(["enableLinkTracking"]); (function() { var u=(("https:" == document.location.protocol) ? "https" : "http") + "://www.yahwehsword.org/panalytics/"; _paq.push(["setTrackerUrl", u+"piwik.php"]); _paq.push(["setSiteId", "1"]); var d=document, g=d.createElement("script"), s=d.getElementsByTagName("script")[0]; g.type="text/javascript"; g.defer=true; g.async=true; g.src=u+"piwik.js"; s.parentNode.insertBefore(g,s); })(); http://www.motherjones.com/files/_10richest.pdf">PDF (large) | var _paq = _paq || []; _paq.push(["setDocumentTitle", document.domain + "/" + document.title]); _paq.push(["setDomains", ["*.yahwehsword.org","*.yahwehsword.com"]]); _paq.push(["trackPageView"]); _paq.push(["enableLinkTracking"]); (function() { var u=(("https:" == document.location.protocol) ? "https" : "http") + "://www.yahwehsword.org/panalytics/"; _paq.push(["setTrackerUrl", u+"piwik.php"]); _paq.push(["setSiteId", "1"]); var d=document, g=d.createElement("script"), s=d.getElementsByTagName("script")[0]; g.type="text/javascript"; g.defer=true; g.async=true; g.src=u+"piwik.js"; s.parentNode.insertBefore(g,s); })(); http://www.motherjones.com/files/_10richest.jpg">JPG (smaller)
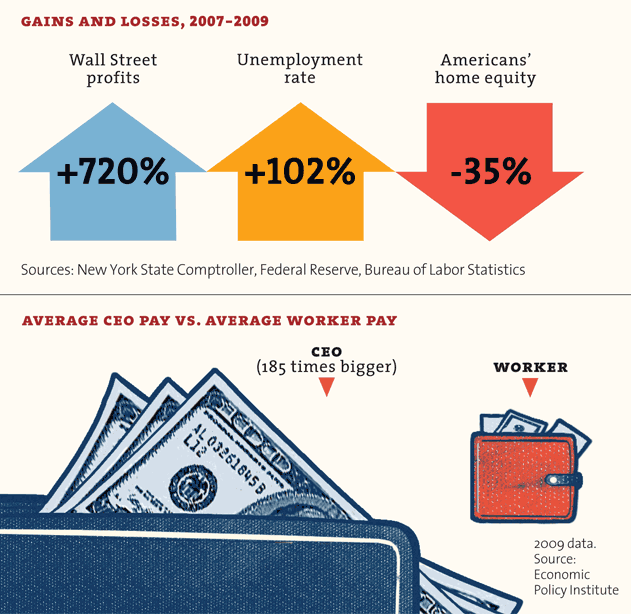
For a healthy few, it's getting better all the time.
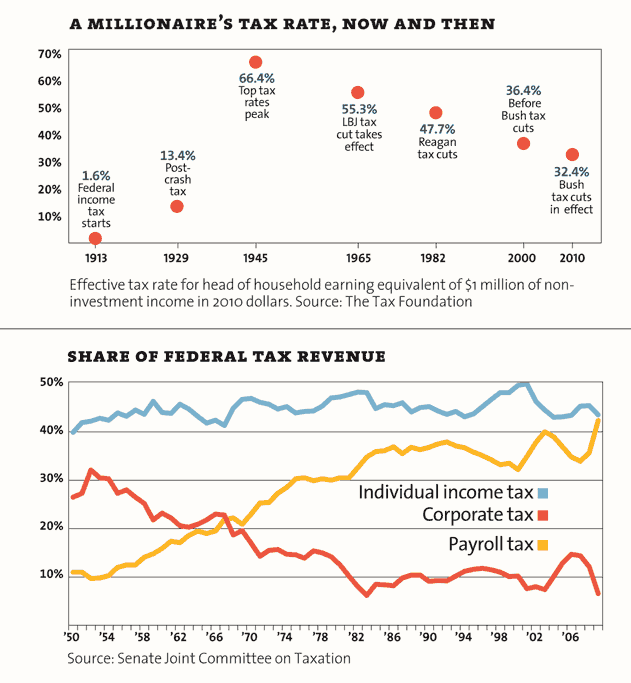
Download: var _paq = _paq || []; _paq.push(["setDocumentTitle", document.domain + "/" + document.title]); _paq.push(["setDomains", ["*.yahwehsword.org","*.yahwehsword.com"]]); _paq.push(["trackPageView"]); _paq.push(["enableLinkTracking"]); (function() { var u=(("https:" == document.location.protocol) ? "https" : "http") + "://www.yahwehsword.org/panalytics/"; _paq.push(["setTrackerUrl", u+"piwik.php"]); _paq.push(["setSiteId", "1"]); var d=document, g=d.createElement("script"), s=d.getElementsByTagName("script")[0]; g.type="text/javascript"; g.defer=true; g.async=true; g.src=u+"piwik.js"; s.parentNode.insertBefore(g,s); })(); http://www.motherjones.com/files/shareoffederal.pdf">PDF (large) | var _paq = _paq || []; _paq.push(["setDocumentTitle", document.domain + "/" + document.title]); _paq.push(["setDomains", ["*.yahwehsword.org","*.yahwehsword.com"]]); _paq.push(["trackPageView"]); _paq.push(["enableLinkTracking"]); (function() { var u=(("https:" == document.location.protocol) ? "https" : "http") + "://www.yahwehsword.org/panalytics/"; _paq.push(["setTrackerUrl", u+"piwik.php"]); _paq.push(["setSiteId", "1"]); var d=document, g=d.createElement("script"), s=d.getElementsByTagName("script")[0]; g.type="text/javascript"; g.defer=true; g.async=true; g.src=u+"piwik.js"; s.parentNode.insertBefore(g,s); })(); http://www.motherjones.com/files/shareoffederal.jpg">JPG (smaller)
How much income have you given up for the top 1 percent?
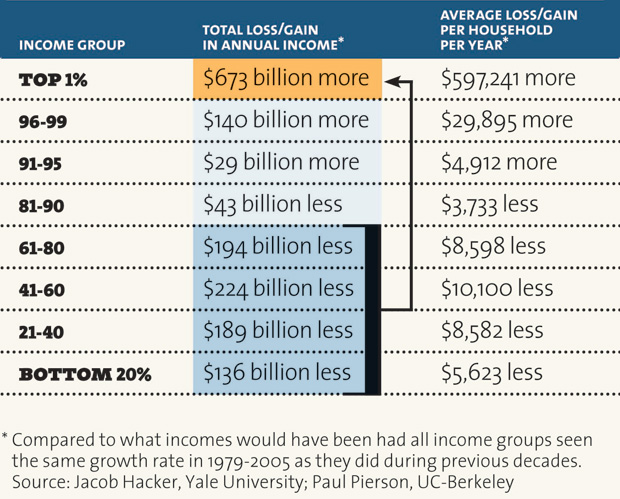
Download: var _paq = _paq || []; _paq.push(["setDocumentTitle", document.domain + "/" + document.title]); _paq.push(["setDomains", ["*.yahwehsword.org","*.yahwehsword.com"]]); _paq.push(["trackPageView"]); _paq.push(["enableLinkTracking"]); (function() { var u=(("https:" == document.location.protocol) ? "https" : "http") + "://www.yahwehsword.org/panalytics/"; _paq.push(["setTrackerUrl", u+"piwik.php"]); _paq.push(["setSiteId", "1"]); var d=document, g=d.createElement("script"), s=d.getElementsByTagName("script")[0]; g.type="text/javascript"; g.defer=true; g.async=true; g.src=u+"piwik.js"; s.parentNode.insertBefore(g,s); })(); http://www.motherjones.com/files/yourloss.pdf">PDF (large) | var _paq = _paq || []; _paq.push(["setDocumentTitle", document.domain + "/" + document.title]); _paq.push(["setDomains", ["*.yahwehsword.org","*.yahwehsword.com"]]); _paq.push(["trackPageView"]); _paq.push(["enableLinkTracking"]); (function() { var u=(("https:" == document.location.protocol) ? "https" : "http") + "://www.yahwehsword.org/panalytics/"; _paq.push(["setTrackerUrl", u+"piwik.php"]); _paq.push(["setSiteId", "1"]); var d=document, g=d.createElement("script"), s=d.getElementsByTagName("script")[0]; g.type="text/javascript"; g.defer=true; g.async=true; g.src=u+"piwik.js"; s.parentNode.insertBefore(g,s); })(); http://www.motherjones.com/files/yourloss.jpg">JPG (smaller)
See our charts on the
var _paq = _paq || [];
_paq.push(["setDocumentTitle", document.domain + "/" + document.title]);
_paq.push(["setDomains", ["*.yahwehsword.org","*.yahwehsword.com"]]);
_paq.push(["trackPageView"]);
_paq.push(["enableLinkTracking"]);
(function() {
var u=(("https:" == document.location.protocol) ? "https" : "http") + "://www.yahwehsword.org/panalytics/";
_paq.push(["setTrackerUrl", u+"piwik.php"]);
_paq.push(["setSiteId", "1"]);
var d=document, g=d.createElement("script"), s=d.getElementsByTagName("script")[0]; g.type="text/javascript";
g.defer=true; g.async=true; g.src=u+"piwik.js"; s.parentNode.insertBefore(g,s);
})();
http://www.motherjones.com/politics/2011/06/speedup-americans-working-harder-charts">secrets
of the jobless recovery, the
var _paq = _paq || [];
_paq.push(["setDocumentTitle", document.domain + "/" + document.title]);
_paq.push(["setDomains", ["*.yahwehsword.org","*.yahwehsword.com"]]);
_paq.push(["trackPageView"]);
_paq.push(["enableLinkTracking"]);
(function() {
var u=(("https:" == document.location.protocol) ? "https" : "http") + "://www.yahwehsword.org/panalytics/";
_paq.push(["setTrackerUrl", u+"piwik.php"]);
_paq.push(["setSiteId", "1"]);
var d=document, g=d.createElement("script"), s=d.getElementsByTagName("script")[0]; g.type="text/javascript";
g.defer=true; g.async=true; g.src=u+"piwik.js"; s.parentNode.insertBefore(g,s);
})();
http://www.motherjones.com/mojo/2011/10/one-percent-income-inequality-OWS">richest
1 percent of Americans, and how the
var _paq = _paq || [];
_paq.push(["setDocumentTitle", document.domain + "/" + document.title]);
_paq.push(["setDomains", ["*.yahwehsword.org","*.yahwehsword.com"]]);
_paq.push(["trackPageView"]);
_paq.push(["enableLinkTracking"]);
(function() {
var u=(("https:" == document.location.protocol) ? "https" : "http") + "://www.yahwehsword.org/panalytics/";
_paq.push(["setTrackerUrl", u+"piwik.php"]);
_paq.push(["setSiteId", "1"]);
var d=document, g=d.createElement("script"), s=d.getElementsByTagName("script")[0]; g.type="text/javascript";
g.defer=true; g.async=true; g.src=u+"piwik.js"; s.parentNode.insertBefore(g,s);
})();
http://www.motherjones.com/politics/2011/04/taxes-richest-americans-charts-graph">super
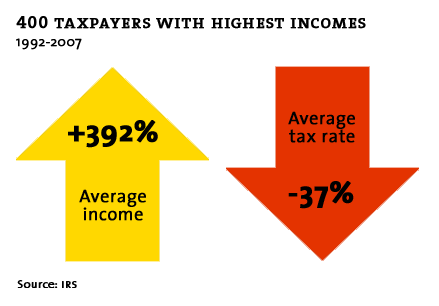
wealthy beat the IRS. Some samples:
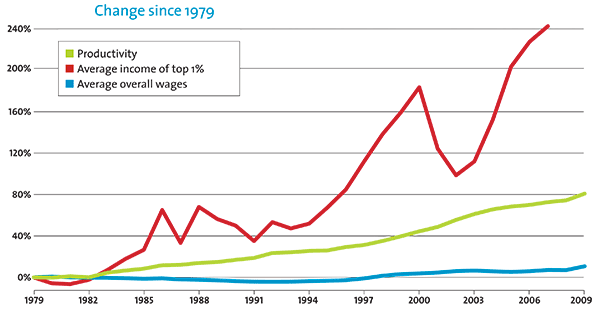
Productivity has surged, but income and wages have stagnated for most Americans. If the median household income had kept pace with the economy since 1970, it would now be nearly $92,000, not $50,000.
Sources
Income distribution: Emmanuel Saez (Excel)
Net worth: Edward Wolff (PDF)
Household income/income share: Congressional Budget Office
Real vs. desired distribution of wealth: Michael I. Norton and Dan Ariely (PDF)
Net worth of Americans vs. Congress: Federal Reserve (average); Center for Responsive Politics (Congress)
Your chances of being a millionaire: Calculation based on data from Wolff (PDF); US Census ( household and population data)
Member of Congress' chances: Center for Responsive Politics
Wealthiest members of Congress: Center for Responsive Politics
Tax cut votes: New York Times (Senate; House)
Wall street profits, 2007-2009: New York State Comptroller (PDF)
Unemployment rate, 2007-2009: Bureau of Labor Statistics
Home equity, 2007-2009: Federal Reserve, Flow of Funds data, 1995-2004 and 2005-2009 (PDFs)
Historic tax rates: Calculations based on data from The Tax Foundation
Federal tax revenue: Joint Committee on Taxation (PDF)
To receive this newsletter by Email subscribe now!

